Screen 5,000+ NYSE and NASDAQ companies across 31 fundamental metrics. Backtest up to 10 years of point-in-time data, then turn the result into a research report a fund would publish. Free to start. $220 a year for everything.
Answering "would this strategy have actually worked?" requires clean data, honest timestamps, and real risk math. Until now, each came with a wall in front of it.
A single Bloomberg Terminal seat lists at $31,980 a year in 2026, and even retail platforms put their best tools behind $39 to $79 a month. Serious research tooling was priced for people whose employer pays the bill.
Most free backtesters quietly cheat twice. They apply financials weeks before the filing became public, and they test only the companies that survived to today. Both inflate results you could never have earned.
The honest alternative was building it yourself: Python, a data subscription, and weekends of debugging survivorship quirks. Most investors never make it past the setup.
SledgeKey exists to take the walls down. All three.
The same loop an institutional research desk runs every morning: screen, construct, evaluate, project. Click through each step below.
The AI Copilot translates natural language into structured filters across all 31 fundamental metrics. Prefer precision? Set every threshold yourself with distribution-aware sliders.
Decide how the strategy actually trades. SledgeKey supports six weighting schemes, four rebalance frequencies, position caps, and transaction cost modeling on every run.
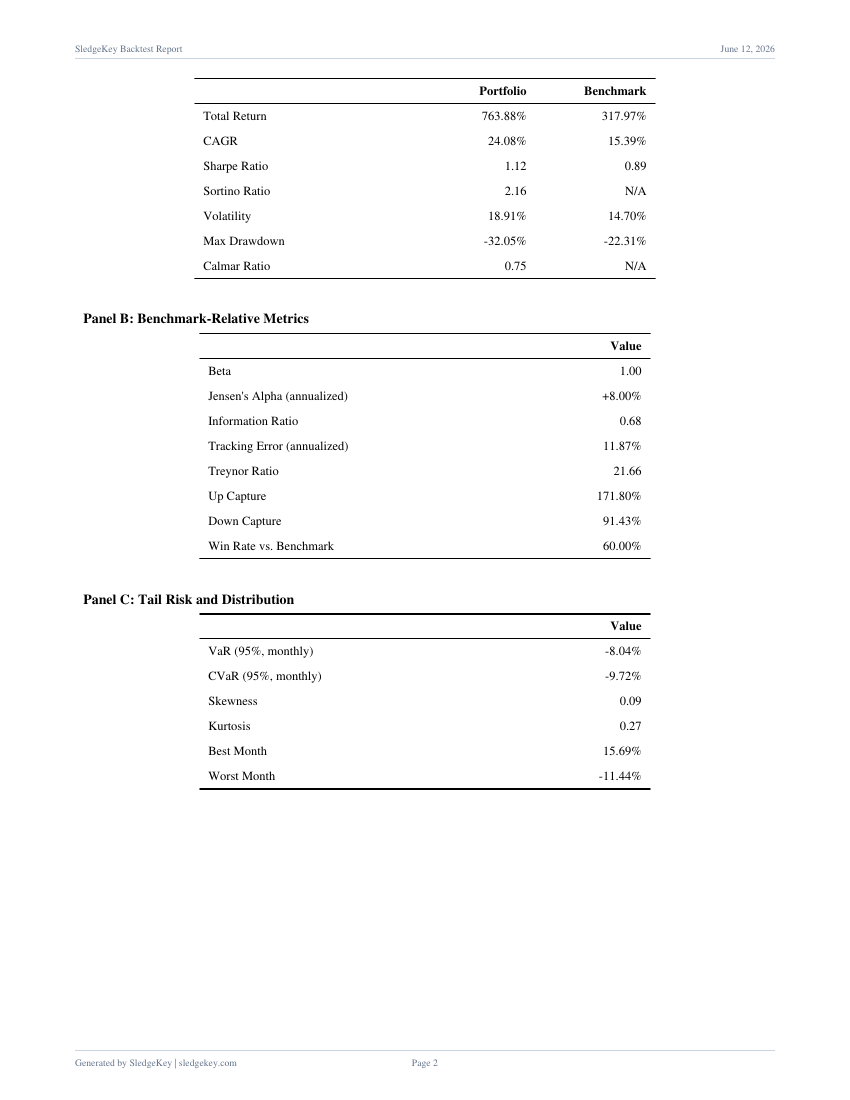
Every run reports the metrics an allocator would ask for: risk-adjusted returns computed with real treasury rates, capture ratios using the CFA convention, and full drawdown analysis.
The Monte Carlo engine resamples your strategy's realized monthly returns with a stationary block bootstrap, preserving momentum and volatility clustering, and projects 5,000 alternative futures over the next five years.
Look-ahead bias and survivorship bias each quietly inflate backtested results. Most free tools commit both. Here is exactly what SledgeKey does differently.
Most tools timestamp fundamentals at the fiscal period end. From January 1st their simulation already "knows" Q4 earnings, roughly eight weeks before the 10-K was filed. That is information no investor had, priced into every trade.
Where most tools apply Q4 data
Where SledgeKey applies it, when the 10-K became public
Most tools build their history from companies listed today, silently erasing every name that delisted or failed along the way. A universe with the losers removed flatters any strategy you run on it.
And one detail most tools skip: risk-adjusted ratios use real 3-month treasury rates from your backtest window, not an assumed constant. Headline Sharpe and Sortino use the average rate over the period; rolling Sharpe uses the rate prevailing in each window. Small detail, honest math.
An RIA team would spend half a day assembling this in Bloomberg and Excel. SledgeKey generates it in under a minute: a 10-section research PDF and an 8-sheet workbook, written and charted from your exact run.
Abstract, methodology, three panels of institutional metrics, portfolio construction, risk decomposition, Monte Carlo projection, AI analysis, conclusion, and a data integrity appendix. Nine figures.
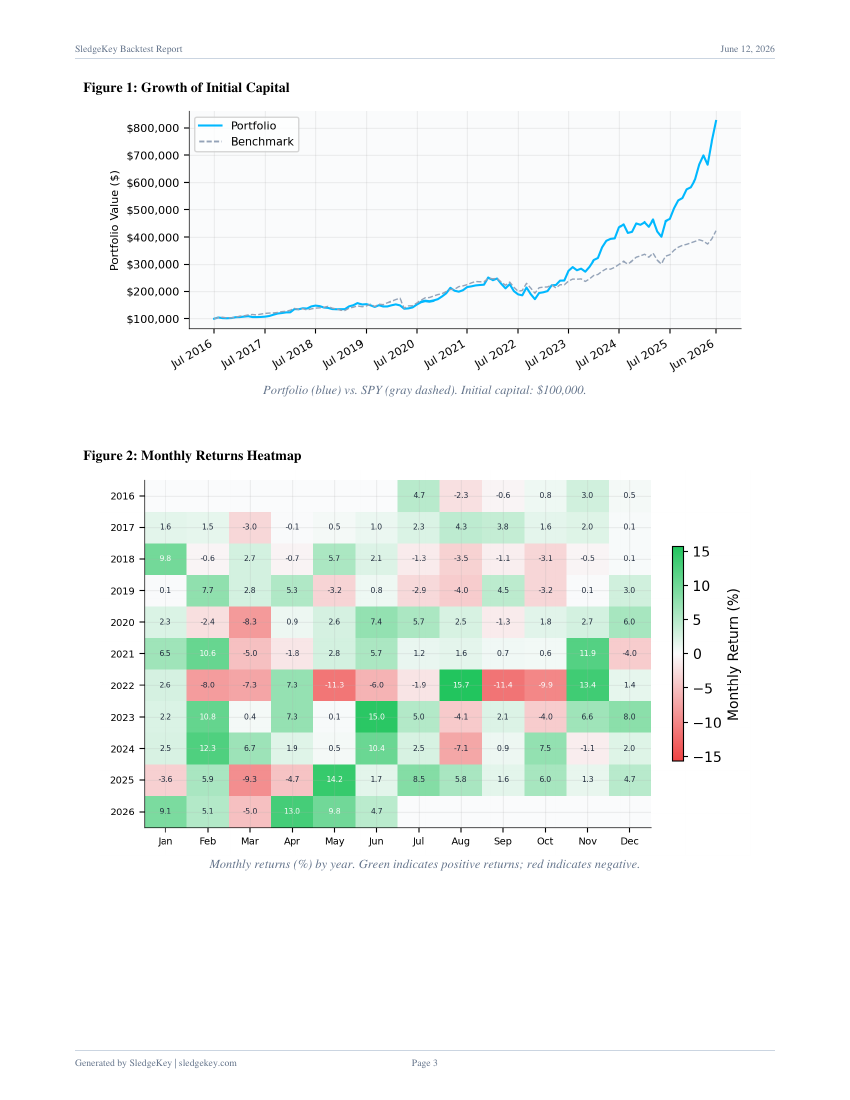
Monthly returns, performance metrics, holdings at every rebalance, sector allocation, drawdown episodes, rolling 12-month, calendar year returns, Monte Carlo fan data.
Strategy assessment, risk observations, and screening commentary, written for your specific backtest. Not boilerplate.
Here is what a year of institutional-grade research tooling costs in 2026.
Published 2026 list prices. SledgeKey+ costs less than one percent of a Bloomberg seat.
I am not a bank. I am one investor who wanted to know whether his ideas actually held up, and got quoted five figures a year for the privilege of finding out.
So I built the tool I wanted: clean point-in-time data, risk math done the way the textbooks say, and a report at the end that I would not be embarrassed to show a professional. No growth team decided the price. It is what I would have been happy to pay.
If something is wrong, you are talking to the person who can fix it. Literally: aaron@sledgekey.com comes straight to me.
Commercial-grade financial data covering NYSE and NASDAQ listed operating businesses, updated daily. The universe deliberately excludes SPACs, ETFs, mutual funds, and trusts, because backtesting against non-operating vehicles produces noise, not signal.
Every fundamental data point is tagged with the date its SEC filing became public, and backtests only use data on or after that date. A company's Q4 numbers do not exist to the simulation until the day they were actually filed. The universe also retains companies that later delisted, so strategies are tested against the market as it was, not just the survivors. Together these prevent look-ahead and survivorship bias, the two most common ways backtests overstate results.
Yes. It is not a trial, it does not expire, and signing up does not ask for a credit card. You get the full screener, the AI Copilot, and 2-year point-in-time backtests indefinitely. SledgeKey+ exists for people who want the full decade of history, hedging, Monte Carlo, and publishable reports.
Yes. Billing is handled through Stripe with a self-serve portal. Cancel in two clicks, no email, no phone call, and you keep access through the end of your billing period.
A 10-section PDF in the style of an academic finance paper: abstract, methodology, three panels of institutional performance metrics, risk decomposition, portfolio construction detail, Monte Carlo projection, AI-written analysis, and references, with nine figures. Plus an 8-sheet Excel workbook with the underlying data. Download the sample and judge it yourself.
No. SledgeKey is a research tool, not an advisor. It shows you how a strategy would have behaved historically and how it might distribute going forward. What you do with that evidence is your decision, and past performance does not guarantee future results.
Screen smarter, test against honest data, and put real evidence behind your conviction.